
A high engagement score can make HR look good. It doesn't necessarily tell you what's going on.
Employee engagement is often reduced to a single number on a dashboard, usually pulled from a survey and presented to leadership as a snapshot of how the workforce is doing. But engagement is not a static number. It shows up in what employees say, but also in what they do: whether they stay, whether they show up, whether they move within the company, and whether they continue to participate.
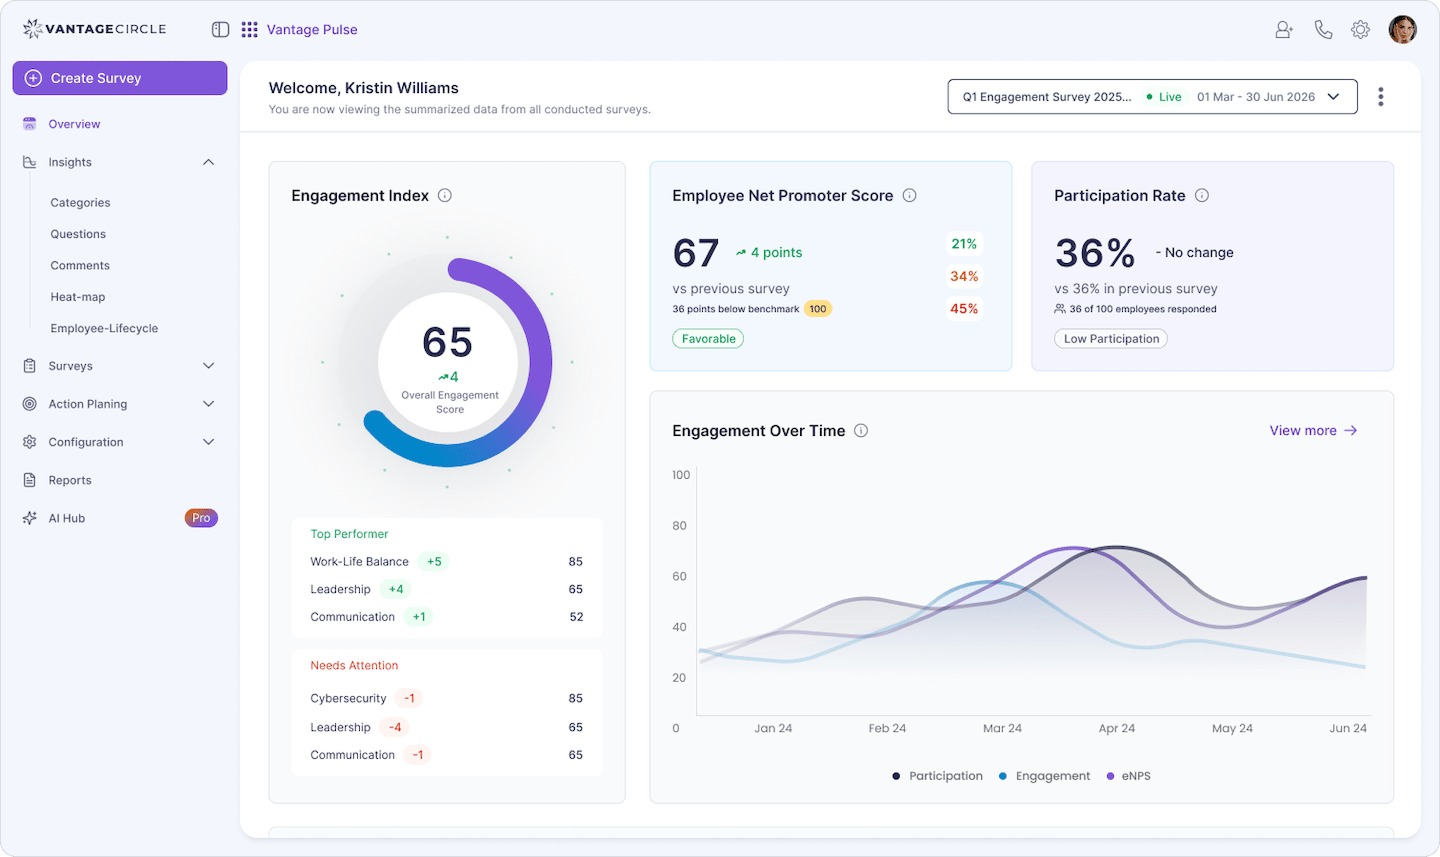
That is why measuring engagement requires more than sending out a survey and watching the score go up or down. The useful metrics are the ones that help HR connect employee sentiment with employee behavior. Some come directly from surveys, such as eNPS, participation rate, and engagement scores. Others come from workforce data, including voluntary turnover, absenteeism, and internal mobility.
And there is an important distinction to make: engagement drivers are not engagement metrics. Recognition, autonomy, trust, and manager support may influence how engaged employees feel, but they are not the same thing as the numbers used to measure the outcome.
This guide breaks down the nine metrics that give HR a more complete picture of employee engagement, along with how to calculate them, what good benchmarks look like, and which five to prioritize when you need to keep your measurement strategy simple.
Key Takeaways
- What Are Employee Engagement Metrics?
- The 9 Employee Engagement Metrics to Track
- How to Measure Employee Engagement: 4 Methods
- How to Calculate an Employee Engagement Score
- Employee Engagement Benchmarks: What Good Looks Like
- If You Track Only 5 Metrics, Track These
- Common Mistakes When Tracking Engagement Metrics
- Frequently Asked Questions
Only 20% of employees worldwide are engaged at work, according to Gallup. The U.S. figure is 31%, the lowest level of U.S. engagement in a decade.
What Are Employee Engagement Metrics?
Employee engagement metrics are quantifiable measurements of how employees feel about, and behave toward, their work and organization, not the causes behind that feeling, and not the shortlist a company reports upward. Those are three different things, and most guides on this topic quietly swap between them.
Metrics vs. Drivers vs. KPIs
A cause
Recognition, autonomy, and the manager relationship are drivers. They explain why engagement moves.
A measurement
eNPS, turnover rate, and absenteeism rate are metrics. Each one produces a number.
A reporting shortlist
The 3 to 5 metrics, pulled from the full list below, that go in front of leadership.
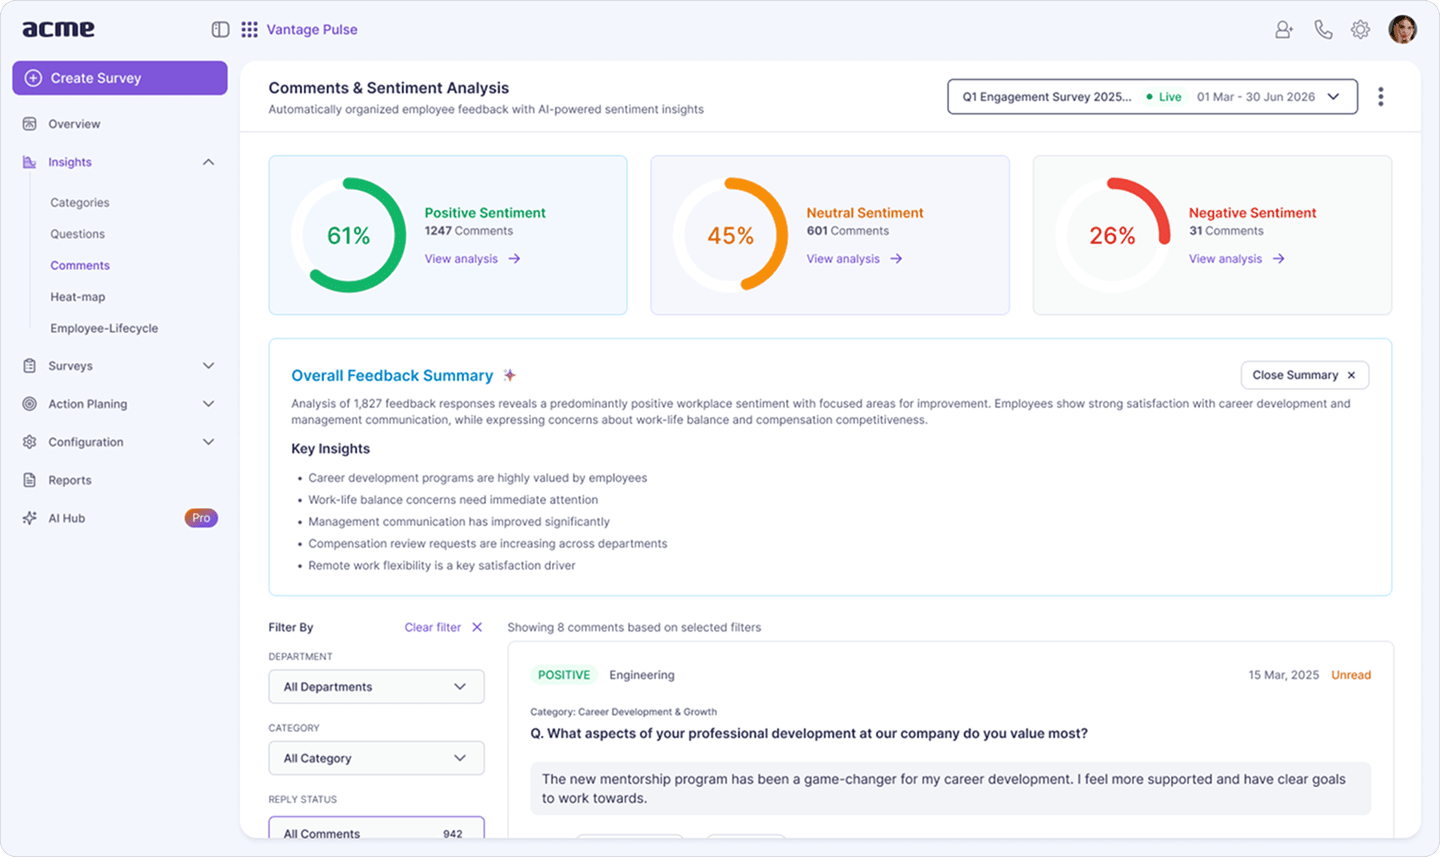
Survey-based metrics, like eNPS and participation rate, measure sentiment directly. Behavioral metrics, like turnover and absenteeism, confirm that sentiment in what people actually do. Drivers get their own treatment in what drives employee engagement. The leadership-facing shortlist lives in employee engagement KPIs.
The 9 Employee Engagement Metrics to Track
Nine metrics cover engagement end to end: five come directly from what employees say, and four confirm it in what they actually do.
Survey-based metrics
1. Employee Engagement Score
The share of favorable responses to your survey's core engagement questions: (favorable responses ÷ total responses) × 100. This is the number most companies mean when they say "our engagement score," and it is the baseline the rest of this list builds on. Gallup's global benchmark is 20% engaged; the U.S. figure is 31%.
2. eNPS (Employee Net Promoter Score)
Whether employees would recommend the company as a place to work, calculated as % promoters minus % detractors, using the same 0 to 10 scale as customer NPS. A negative score means more detractors than promoters. 10 to 30 is good, 30 to 50 is great, and above 50 is excellent, per Perceptyx, with most organizations currently landing in the low-to-mid 20s. See the full eNPS calculation guide for the scoring mechanics.
3. Survey Participation Rate
The share of invited employees who actually respond: (respondents ÷ employees invited) × 100. It is the metric most teams ignore, and the one that tells you whether the rest of the data can be trusted. A 90% favorable score from 20% of the company is a weaker signal than an 80% score from 75% of the company. Culture Amp puts a healthy range at 65% to 85%, depending on company size.
4. ESAT (Employee Satisfaction Score)
The engagement-score formula narrowed to one question, usually pay, workload, or a specific policy, so you can isolate what is actually driving a good or bad overall number. It uses the same calculation as the engagement score, scoped to a single item, and tends to track close to that broader figure.
5. Recognition Frequency
How often employees give or receive recognition: total recognitions given ÷ headcount, over a set period. There is no external benchmark to compare against here, the value is in your own trend over time. It is also the one metric on this list that does not need a survey at all. If your recognition program runs on a platform instead of a spreadsheet or an annual awards night, this number is already sitting in your data.
Behavioral and operational metrics
6. Voluntary Turnover Rate
Employees who choose to leave, as a share of headcount: (voluntary separations ÷ average headcount) × 100. Mercer's 2025 turnover survey puts the U.S. average at 13%. A rising number here is often the first hard evidence that a declining engagement score was not a blip. See how to calculate and reduce turnover for the full breakdown by cause.
7. Retention Rate
The inverse of turnover: ((headcount at period end − new hires during the period) ÷ headcount at period start) × 100. Against a 13% voluntary turnover benchmark, a retention rate in the high 80s tracks as healthy. Report both numbers side by side; retention alone can hide who is actually leaving and why.
8. Absenteeism Rate
Unplanned time away from work: (days absent ÷ total available workdays) × 100. The Bureau of Labor Statistics puts the full-time U.S. worker average at 3.2%. Absenteeism tends to move earlier than turnover, a team with a climbing absenteeism rate is often a team that shows up in next quarter's exit interviews. Full methodology in the employee absenteeism guide.
9. Internal Mobility Rate
Employees moving into new roles inside the company: (internal moves ÷ total headcount) × 100. There is no reliable external benchmark for this one, every industry and org structure produces a different baseline, so the useful version is your own rate, tracked year over year rather than compared against someone else's headcount.
How to Measure Employee Engagement: 4 Methods
You measure employee engagement with four methods used together. Surveys give you the score, interviews give you the why, HR data confirms the trend. No single method gives you the full picture on its own.
- Step 1: Run an annual or baseline survey. This sets the engagement score baseline and covers the full driver set, everything from manager relationships to compensation.
- Step 2: Layer in pulse surveys. Short, frequent check-ins, no more than weekly and no less than monthly, catch a shift before the next annual cycle. Survey providers generally caution against going more frequent than that, response rates collapse from fatigue when the same people are surveyed weekly or biweekly without a break.
- Step 3: Hold stay and exit interviews. Qualitative conversations that explain the "why" behind a number the survey alone cannot answer.
- Step 4: Pull HR system data. Turnover, absenteeism, and internal mobility figures confirm the trend using data employees do not have to self-report.
Source: Vantage Pulse
How to Calculate an Employee Engagement Score
Engagement score and eNPS answer two different questions, and they use two different formulas.
Engagement score answers "how favorable is my workforce, overall?"
- Step 1: Run your survey and count total responses.
- Step 2: Count how many gave a favorable response to the core engagement question.
- Step 3: Divide favorable responses by total responses.
- Step 4: Multiply by 100.
Example: 500 employees respond to your survey. 350 give a favorable response.
Engagement score = (350 ÷ 500) × 100 = 70%
eNPS answers a narrower question: "would employees recommend this company?"
- Step 1: Ask employees to rate, 0 to 10, how likely they are to recommend the company as a place to work.
- Step 2: Calculate the percentage of respondents who scored 9 or 10 (promoters).
- Step 3: Calculate the percentage who scored 0 to 6 (detractors).
- Step 4: Subtract the detractor percentage from the promoter percentage.
Example: of those same 500 respondents, 220 are promoters and 60 are detractors.
eNPS = (220 ÷ 500 × 100) − (60 ÷ 500 × 100) = 44 − 12 = 32, in the "great" range above.
Employee Engagement Benchmarks: What Good Looks Like
There's no universal "good" score for employee engagement. But benchmarks can give you a useful sense of where your organization stands. Globally, engagement sits at 20%, compared with 31% in the U.S., according to Gallup. For eNPS, 10–30 is generally considered good, while 30–50 is strong. A healthy survey participation rate typically falls between 65% and 85%. On the behavioral side, the current U.S. average for voluntary turnover is around 13%, while absenteeism sits at 3.2% for full-time workers. The goal isn't to hit every benchmark. It's to use them as a reference point and look at what your numbers are telling you over time.
Suggested Reading: Curious how these benchmarks break down by industry and company size? Check out Employee Engagement Benchmarks and Employee Engagement Index.
If You Track Only 5 Metrics, Track These
For most teams, five metrics cover engagement end to end: eNPS, survey participation rate, voluntary turnover, absenteeism, and recognition frequency. Together they give one sentiment signal, one trust-in-the-process signal, and three behavioral confirms that do not depend on anyone filling out a survey.
A pattern worth naming: companies over-index on the annual engagement score, run once a year and picked apart in a single meeting, and under-use participation rate and recognition frequency. Both move earlier than the annual score, and both are already sitting in data you collect anyway, no extra survey required.
Common Mistakes When Tracking Engagement Metrics
- Measuring once a year and calling it done. An annual survey tells you where things stood on the day people answered it. Without pulse checks in between, a real problem can run for months before the next survey even asks about it.
- Chasing the score instead of what moved it. A jump from 62% to 74% looks like good news until you find out it happened because the least engaged 15% of the team just quit. Check what changed underneath the number before you celebrate or panic.
- Ignoring participation rate entirely. A survey that only 40% of the company answers is not measuring the company, it is measuring the people who were already willing to talk. Low participation is itself a finding, not a footnote.
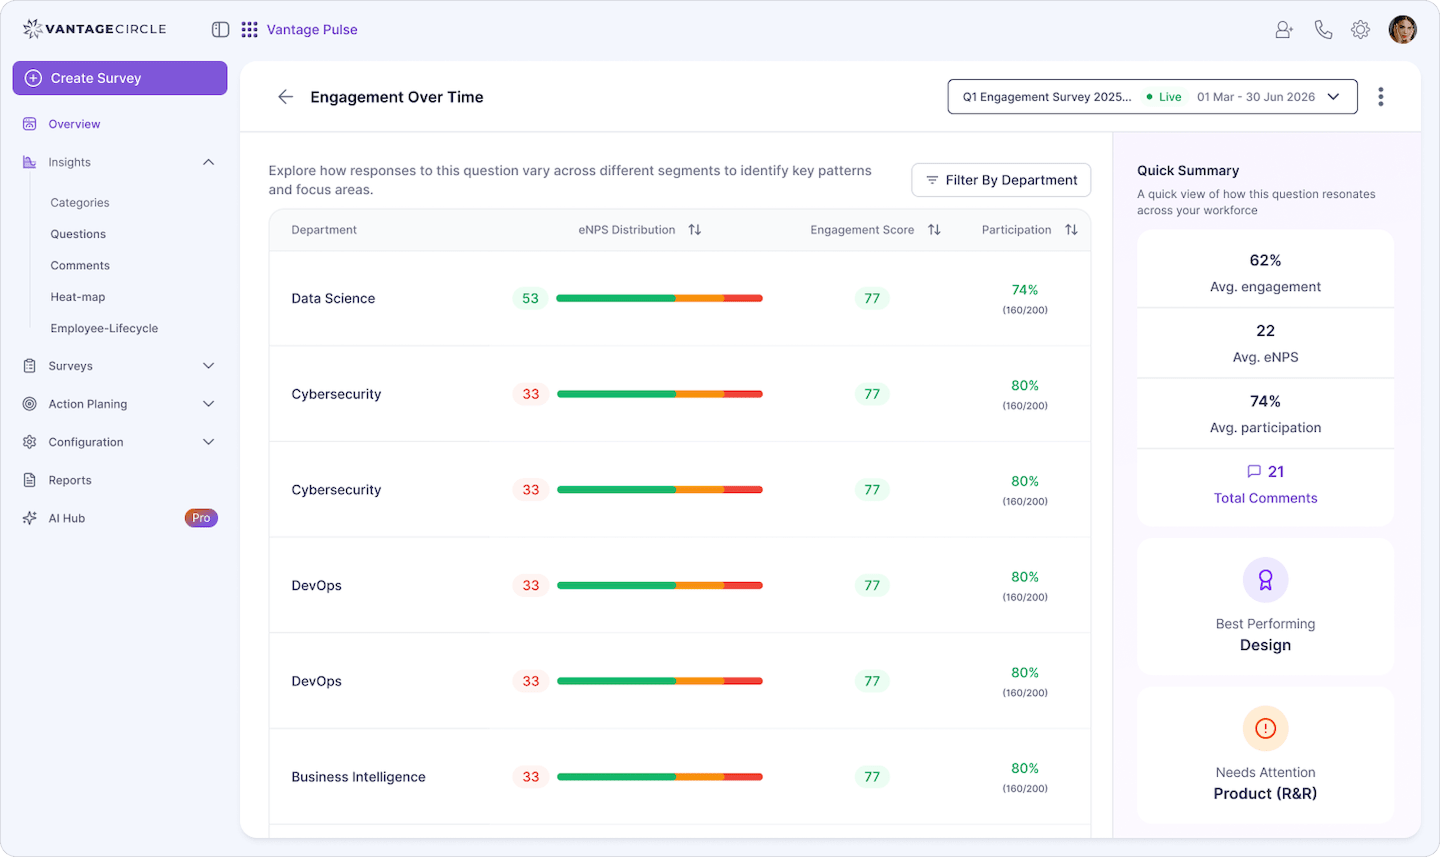
- Reporting one company-wide average. A healthy 70% average can hide one team at 95% and another at 30%. Cut every number by team, function, and tenure before deciding there is nothing to fix.
- Running the survey and going quiet afterward. Nothing lowers a survey's next participation rate faster than employees who answered honestly and never heard what happened as a result. Close the loop, even briefly, before you ask again.
Frequently Asked Questions
What's a good employee engagement score?
There is no universal passing score, but Gallup's benchmarks give you a real comparison point: 20% engaged globally, 31% in the U.S. Gallup attributes much of the recent decline specifically to manager engagement itself falling since 2023, so a company scoring meaningfully above either benchmark, with managers who are themselves engaged, is doing something most of the market currently is not.
What is a good eNPS score for employees?
On the commonly used eNPS scale, below 0 is poor, 0 to 10 is modest, 10 to 30 is good, 30 to 50 is great, and above 50 is excellent. Most organizations currently sit in the low-to-mid 20s, which is the number to beat, not zero.
How is an employee engagement score calculated?
Divide the number of favorable responses to your engagement questions by the total number of responses, then multiply by 100. eNPS is calculated separately as the percentage of promoters minus the percentage of detractors, using the steps above.
What is the difference between an engagement metric and an engagement driver?
A driver is a cause, like recognition or autonomy. A metric is a measurement, like eNPS or turnover rate. Drivers explain why a metric moved; metrics tell you that something moved.
What is a KPI for employee engagement?
A KPI is the small set of engagement metrics, usually 3 to 5, that gets reported to leadership on a regular cadence, pulled from the larger list of metrics an HR team tracks day to day.
How often should you measure employee engagement?
Combine one annual or baseline survey with shorter pulse surveys run no more than weekly and no less than monthly, the range most survey providers recommend before response rates start dropping from fatigue. The annual survey sets the full baseline; pulse surveys catch a shift in between. If you cannot act on results at a given cadence, do not increase the frequency just to collect more data you will not use.
What are the 5 C's of employee engagement?
There is no single agreed-on version. Most frameworks circle the same two ideas, connection and communication, and differ on the remaining three. See the 5 C's of employee engagement for the full breakdown.
Conclusion: Measure Less, Act More
Gallup's own explanation for why engagement keeps sliding is not mysterious: manager engagement itself has been falling since 2023, and that decline drags down everyone who reports to a disengaged manager. It is not a subtle finding, and it is not one that a sixteenth metric on a dashboard will fix.
What actually helps is boring by comparison. Track the nine metrics that separate signal from noise, not fifteen drivers dressed up as metrics. Report them by team, not as one company-wide average that hides which teams are actually struggling. And close the loop on every survey you run, a participation rate that drops the second time is not a data problem, it is employees telling you the first survey went nowhere.
None of this requires an enterprise engagement platform to start. It requires picking five numbers, eNPS, participation rate, voluntary turnover, absenteeism, and recognition frequency, and looking at them monthly instead of annually. The organizations narrowing the engagement gap right now are not the ones measuring more. They are the ones acting on what they already measure.
Recommended Read: Employee Engagement KPIs: The 12-Metric Framework HR Uses in 2026

Shaoni Gupta is a content marketing specialist at Vantage Circle, with expertise in scriptwriting and copywriting in the field of employee rewards and recognition.
Connect with Shaoni on LinkedIn.