Every HR leader has been in this meeting.
You present the recognition program budget. Finance asks what the return is. You talk about engagement, morale, culture. Finance nods politely and cuts the line item by 40%.
It is not that they are wrong to ask. It is that we have not been giving them the right answer.
Recognition has a measurable financial return. Most HR content explains why recognition matters. This post gives you the recognition program business case your CFO actually needs: a formula, benchmarks from the largest employee recognition study of its kind, covering 5.7 million employees, and client data from programs that have already run this math at enterprise scale.
Key Takeaways
- Why recognition programs lose budget and what the employee retention cost of that decision looks like
- The three financial inputs that make up an employee recognition ROI calculation
- A worked example: 1,000-person company, $65K average salary, 18% turnover
- What high-recognition programs actually delivered, connected back to the formula
- The leading metrics that proxy recognition ROI before attrition data can confirm it
Why Recognition Programs Lose Budget: The Retention Cost HR Leaders Miss
The irony of recognition budget cuts is that they often cost far more than the programs they eliminate.
Gallup's State of the Global Workplace report puts the global cost of disengagement at $8.8 trillion in lost productivity. In the US, 77% of employees are not engaged or actively disengaged. That is not a soft number. It is a drag on output, quality, customer service, and retention that finance is already absorbing, without seeing it labeled as such.
The employee retention cost calculation makes this concrete. Replacing one employee costs between 50% and 200% of their annual salary in recruiting, onboarding, and ramp-up time. For a 1,000-person company at 18% annual attrition, that is $11.7 million walking out the door every year. The programs we cut to save $50,000 are often the ones preventing $3 million in backfill costs.
There is another trap worth naming: satisfaction is not the same as retention. A significant share of satisfied employees still plan to leave within the year. Satisfaction is a feeling. Belonging and recognition are what convert that feeling into a decision to stay. That gap is exactly what the HR budget justification for recognition must capture.

Vantage Influencers Podcast
"If you create that culture of recognition, research shows that your people will be seven times more likely to stay, to want to stay working for your company for the rest of their career."
— Dr. Bob Nelson, Author of 1501 Ways to Reward Employees
Listen to the EpisodeBuilding the Recognition Program Business Case for Finance
Finance does not need to believe in recognition culture to approve the budget. They need to see three things: what it costs, what it saves, and whether the math holds.
The question is not "do our employees feel appreciated?" The question is "what does this program save us, and how does that compare to what we spend?"
There are three inputs to a recognition ROI model that translate into financial language:
- Turnover cost reduction. Voluntary attrition is expensive, predictable, and disproportionately affected by recognition. This is the largest and most defensible input in any recognition program business case.
- Productivity improvement. Recognized employees perform better and stay focused longer. Treat this as upside in your model, not the foundation. More on this below.
- Customer impact. Employees who feel valued bring that to their client or customer interactions in measurable ways.
Run those three numbers, compare them to program cost, and you have a business case finance can act on.
How to Calculate Employee Recognition ROI
The core formula:
Recognition ROI = (Turnover Savings + Productivity Lift + Customer Impact Gains) / Program Cost
Here is how to build each input.
Input 1: Turnover Savings
This is the most quantifiable input and where the business case for employee recognition programs is most defensible.
The clearest evidence comes from Vantage Circle's own research. The Recognition Effect study, conducted with Great Place to Work India across 5.7 million employees at 2,000 organizations, found that in high-recognition cultures, 92% of employees express intent to stay. In organizations with emerging recognition practices, that number falls to 76%.
SHRM research (2023) validates the magnitude: companies with effective recognition programs experience 31% lower voluntary turnover. That is the benchmark to use in your model. Apply the 31% reduction to your current attrition rate, multiply by your headcount, and calculate savings at one times annual salary as a conservative floor.
Input 2: Productivity Improvement
The conservative business case approach is to treat productivity as upside rather than the primary argument. Close the HR budget justification on retention math alone. At 72.8x ROI from turnover savings, you do not need productivity to make the case. If finance accepts the retention assumption, stop there.
If they push back, here is the second line of defense. Gallup's 2023 State of the Global Workplace report found that organizations with strong recognition practices see a 23% improvement in business outcomes. A Harvard Business Review analysis found that continuous behavioral reinforcement drives a 12% increase in productivity compared to annual feedback cycles. Even if you apply half of either figure to your calculation, the productivity uplift still exceeds program cost by a multiple.
The point to land with finance: recognition is the only total rewards investment that touches employees continuously across all 365 working days. Salary, bonuses, and benefits interact with employees a handful of times per year. Recognition, at the frequency the best programs achieve, is daily behavioral reinforcement. The productivity effect is real; it just compounds slowly enough that it is hard to attribute quarter by quarter.
Input 3: Customer Impact
The Recognition Effect study found that in high-recognition cultures, 94% of employees say their organization delivers excellent customer service, compared to 82% in organizations with emerging recognition practices. That 12-point gap in customer service quality has a direct line to revenue, churn, and NPS in customer-facing businesses.
Deloitte's Human Capital Trends Report (2023) puts a number on it: employees who feel genuinely appreciated show 18% higher customer satisfaction scores than their disengaged counterparts.
For internal teams, the equivalent metric is absenteeism. Valued employees show up consistently. Absenteeism reduction is one of the more trackable program impacts over a 12-month period and translates directly into operational continuity.
A Worked Example: 1,000-Person Company
Here is what the formula looks like with real inputs, using the Recognition Effect study's 92% vs 76% retention intent data and SHRM's 31% voluntary turnover reduction benchmark.
| Input | Value |
|---|---|
| Employee count | 1,000 |
| Average annual salary | $65,000 |
| Current voluntary turnover rate | 18% (180 employees/year) |
| Replacement cost per employee | 100% of salary = $65,000 |
| Annual turnover cost | 180 x $65,000 = $11.7 million |
| Recognition program cost | $50 per employee x 1,000 = $50,000/year |
Scenario: Apply the 31% voluntary turnover reduction (SHRM 2023).
| Calculation | Value |
|---|---|
| New voluntary turnover rate | 12.4% (124 employees/year) |
| Employees retained | 180 - 124 = 56 fewer departures |
| Turnover cost saved | 56 x $65,000 = $3.64 million |
| Program cost | $50,000 |
| Net first-year saving | $3.59 million |
| ROI multiple (turnover alone) | 72.8x |
This is the retention-only scenario, the conservative floor. Productivity improvement and customer impact gains are additive to this number.
The program costs $50,000 per year. The employee retention saving alone is $3.59 million. That is the number finance responds to.
What 5.7 Million Employees Reveal About Recognition ROI
Before looking at client examples, it is worth spending a moment on what makes the Recognition Effect data different from the third-party benchmarks most recognition content relies on.
The Vantage Circle and Great Place to Work India study covered 5.7 million employees across 2,000 organizations in more than 20 industries. It is not a survey of 500 HR professionals or a poll of platform users. It is a study of what employees at scale actually reported about how recognition affected their intent to stay, their pride in their organization, their sense of agility, and their motivation.
The numbers across high-recognition versus emerging recognition cultures:
| Metric | High-Recognition Culture | Emerging Recognition Culture |
|---|---|---|
| Intent to stay | 92% | 76% |
| Excellent customer service | 94% | 82% |
| Organizational agility | 93% | 78% |
| Employee motivation | 91% | 73% |
| Organizational pride | 95% | 82% |
Every one of these gaps translates into a financial input. Intent to stay is turnover cost. Customer service is revenue retention. Agility is competitive responsiveness. Motivation is output per employee. The Recognition Effect study does not just say recognition matters. It quantifies the gap between organizations that have built recognition into their culture and those that have not.
Only 55% of employees feel truly recognized at work, according to the Recognition Effect study. That means nearly half of most workforces, including top performers, are in the emerging recognition category, not the high-recognition one. The retention math for that half of the workforce is significantly worse.
What Enterprise Programs Actually Delivered
Three programs illustrate what happens when recognition frequency reaches the threshold where the ROI formula's inputs start moving.
L&T Technology Services (LTTS): The ROAR program reached 93% employee participation, with recognition happening every 35 minutes on average across 23,800 employees. Over two years, the program generated 78,000 recognition moments. A receiver coverage rate of 93% is well above the 70% threshold where recognition frequency begins to shift retention intent consistently. The program won Brandon Hall Gold 2024.
Wipro: Winners' Circle achieved 57% recognition coverage across a workforce of more than 230,000 employees, with one recognition happening every 1.2 minutes. Coverage at that scale does not happen by accident. The 97.5% increase in non-monetary recognition over two years reflects a shift in manager behavior, not just employee participation. That behavioral change is what sustains the retention effect in the formula above beyond year one. Brandon Hall Gold 2023.
Tata Communications: The Applause program produced a 185% surge in peer-to-peer recognition and a 134% increase in active users over five years. Growth in peer recognition at that rate is the leading indicator that precedes retention improvement: when employees start recognizing each other without being prompted, the culture has internalized appreciation as a norm rather than an HR initiative. Brandon Hall Gold 2024.
The bridge back to the formula: each of these programs operates at the recognition frequency and coverage levels where SHRM's 31% voluntary turnover reduction benchmark consistently applies. The client results are not independent of the formula. They are evidence that the formula's inputs are achievable at scale.
How to Measure Employee Recognition ROI After Launch
The most common frustration I hear from HR leaders is that recognition ROI takes months to appear in attrition data. By the time voluntary turnover drops, the budget cycle has already passed.
The solution is to track leading indicators: metrics that shift before attrition does, and that give finance a signal they can read in real time.
Three North Star Metrics to monitor via the AIRe framework:
- Receiver Coverage: the percentage of employees who received recognition in a given month. Below 70%, the culture is not yet in the frequency range where the ROI formula's inputs are moving in the right direction.
- Giver Coverage: the percentage of managers actively giving recognition. This is the strongest predictor of program longevity. If giver coverage is low, the program is dependent on a small group of participants and will not sustain the retention effect.
- Recognition Frequency: the average time between recognition events. Use LTTS (every 35 minutes) and Wipro (every 1.2 minutes) as enterprise benchmarks. Your number will be different, but the trend direction is what matters.
Secondary metrics to track alongside these: voluntary attrition rate (monthly, not annual), eNPS trend from pulse surveys, absenteeism rate, and peer recognition participation rate. When Receiver Coverage and Giver Coverage trend down together, voluntary attrition typically follows within one to two quarters. That is the early warning window, well before attrition data shows up in the finance model.
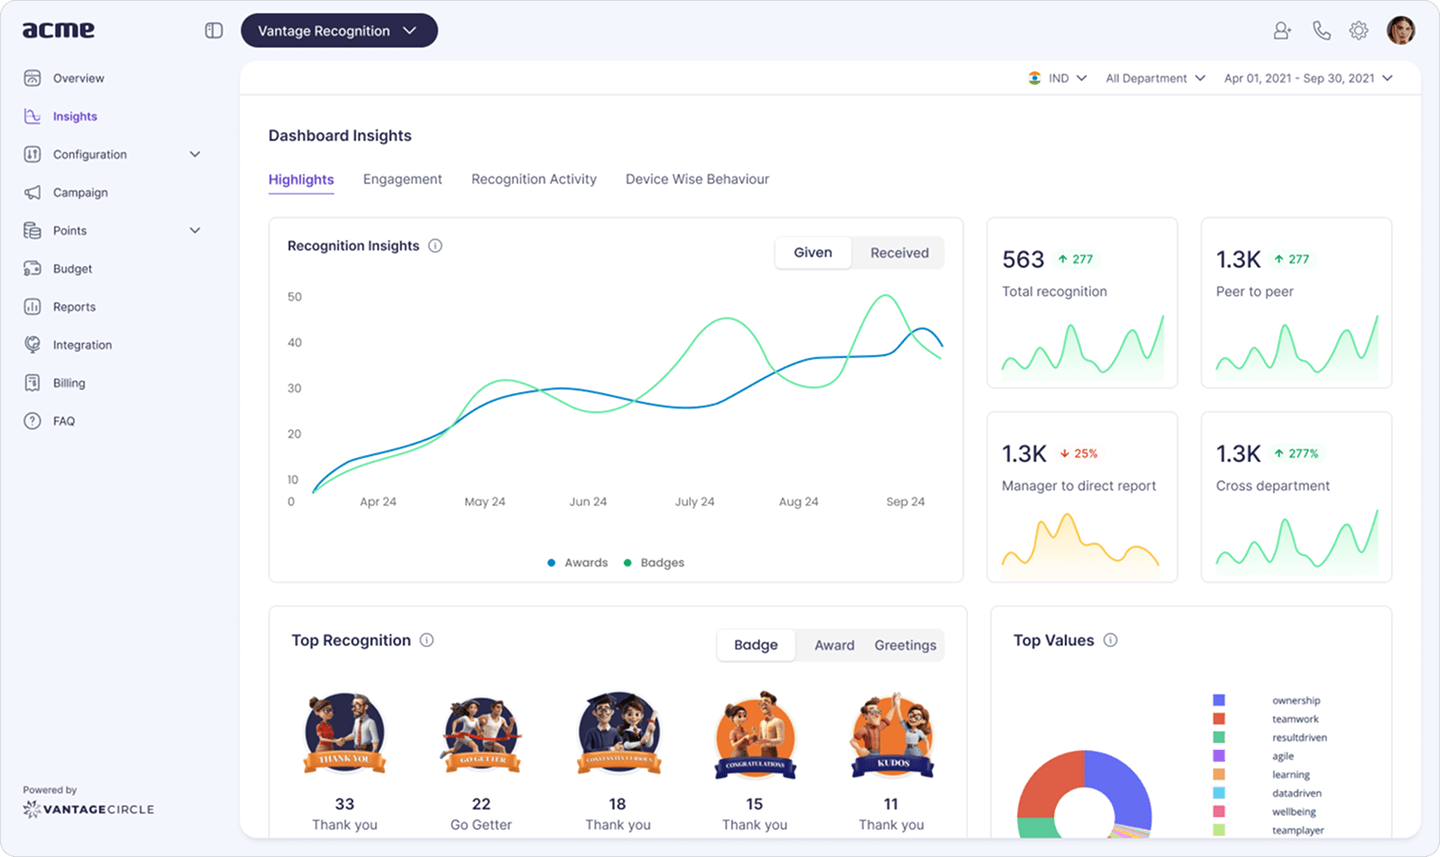
Vantage Pulse connects recognition activity data with employee sentiment trends automatically, so HR can show finance a causal signal rather than a correlation.
Frequently Asked Questions
What is a realistic ROI for an employee recognition program?
Based on SHRM's 31% voluntary turnover reduction benchmark and a conservative replacement cost of one times annual salary, a 1,000-person company at 18% attrition and $65K average salary saves $3.59 million against a $50,000 program cost. That is a 72.8x return on turnover savings alone, before counting productivity improvement or customer impact gains. Programs that reach the receiver coverage and recognition frequency thresholds consistently hit this range.
How do you calculate the ROI of employee recognition?
Use this formula: Recognition ROI = (Turnover Savings + Productivity Lift + Customer Impact Gains) / Program Cost. For turnover savings, apply the 31% voluntary turnover reduction from SHRM 2023 to your current attrition rate, multiply retained employees by replacement cost (50-200% of annual salary). Build your primary case on retention math. Productivity and customer impact gains are additive inputs that strengthen the model without being load-bearing.
How do you present the recognition program business case to a CFO?
Lead with retention math, not engagement philosophy. Calculate your current annual turnover cost (departures per year multiplied by average replacement cost). Apply the SHRM 31% reduction and show the delta. Compare that saving to program cost. The ratio will almost always exceed 20x. Present productivity and customer satisfaction improvements as additive upside rather than primary claims. Bring the Vantage Circle ROI Calculator output as a leave-behind with your specific inputs filled in.
How long does it take to see ROI from a recognition program?
Receiver Coverage and Giver Coverage shift within the first 60 to 90 days of a well-implemented program. eNPS trends typically move within one to two survey cycles, which is 90 to 180 days. Voluntary attrition improvement is visible in quarterly data after 6 to 12 months. The leading indicators give you something to show finance well before the retention numbers confirm the thesis. Track them from launch, not from the annual review.
Most recognition programs do not fail because they are too generous. They fail because HR cannot show what they save.
The retention math is not complicated. The employee retention cost of doing nothing is measurable. The recognition program business case for fixing it is defensible.
Build the formula. Run the number. Bring it to the meeting.
Run Your Recognition ROI in Under 2 Minutes
Enter your headcount, average salary, and current attrition rate. The Vantage Circle ROI Calculator applies the SHRM 31% turnover reduction benchmark and outputs a business case ready for your next finance meeting.
Built for HR leaders who need numbers, not just narrative.
Calculate Your ROI →Written by