When I saw four people from my team leave in just two months, I kept asking the same question: why now? Employee retention metrics are how I found the answer.
Employee retention metrics are the measures HR uses to track how well an organization keeps its people over time. The core one is employee retention rate: the share of employees at the start of a period who are still employed at the end. Others, like eNPS and recognition coverage, signal who may leave before they do.
Replacing someone is expensive. The Work Institute conservatively estimates the financial impact of turnover at 33% of an employee's base pay (2025 Retention Report). So it helps to know which numbers warn you early and which ones only tell you what already happened.
Here is what you will get below: the retention rate formula done correctly, 12 metrics sorted by whether they warn you or just report, benchmarks with sources, and a scorecard you can copy.
Retention vs turnover in one line
Retention counts who stayed. Turnover counts who left. You need both to understand what is going on.
What Are Employee Retention Metrics?

Employee retention metrics are quantitative and survey-based measures that show who stays, for how long, and who is at risk of leaving.
I used to treat retention and turnover as the same number seen from two sides. They are not. Retention asks how many of your starting group are still here, and turnover asks how many people left. The denominators differ, so the two rarely mirror each other.
Retention metrics also come in two kinds. Lagging metrics count exits after they happen, so they confirm a problem. Leading metrics flag risk early, while you still have time to do something about it. Most dashboards are packed with the first kind and nearly empty of the second.
| Measure | Retention rate | Turnover rate |
|---|---|---|
| What it counts | People from the starting group who are still employed | People who left during the period |
| Formula | (Start headcount − departures from that group) ÷ start headcount × 100 | Departures ÷ average headcount × 100 |
| Denominator | Headcount at the start of the period | Average of start and end headcount |
| Typical use | Workforce stability, tracked by team or cohort | Cost, hiring plans, exit trends |
| Healthy direction | Higher | Lower |
How Do You Calculate Employee Retention Rate?
Employee retention rate = (employees at the start of the period who are still employed at the end ÷ employees at the start) × 100. Leave out anyone hired during the period. A company that starts the year with 200 people and still has 180 of them in December has a 90% retention rate.
Here is one illustrative company that I will use for every formula in this guide. It is an example dataset, not client data.
| Input | Value | Note |
|---|---|---|
| Start headcount (cell B2) | 200 | People employed on day one of the year |
| Departures from that group (B3) | 20 | 14 voluntary, 6 involuntary |
| New hires during the year (B4) | 30 | Not part of the starting group |
| End headcount (B5) | 210 | 200 − 20 + 30 |
| Retention rate | 90% | (200 − 20) ÷ 200 × 100 |
The most common retention formula mistake
Many guides use (End headcount − Departures) ÷ Start headcount. That counts new hires as retained. With the numbers above it gives (210 − 20) ÷ 200 = 95% instead of 90%. Always take new hires out of the numerator.
Three things trip people up when they build this in a sheet:
- Pick one period and keep it fixed. Quarterly is the usual dashboard cadence, with an annual figure for board reporting.
- To annualize a quarterly rate, multiply the four quarterly rates (as decimals) together rather than adding them. A 97.5% rate for four quarters in a row compounds to about 90.4%.
- If someone hired mid-year also leaves mid-year, that exit counts in turnover but not in the retention rate, because they were never in the starting group.
12 Employee Retention Metrics to Track (With Formulas)

The 12 metrics below fall into two groups: 7 lagging metrics that confirm what happened and 5 leading metrics that flag risk early.
Each metric follows the same order: what it measures, the formula, the number from our example company, what good looks like, and what to do when it moves.
Lagging Metrics: What Already Happened
Lagging metrics confirm an outcome after it has happened, so they are the ones to report quarterly and the ones leadership will ask about first.
1. Overall Retention Rate
Overall retention rate measures the share of your starting headcount that is still with you at the end of a period.
In our example company it comes to 90%. There is no universal standard for a healthy year, because the right number depends on your industry and role (see the benchmarks below). If it slips, resist reacting to the company-wide figure. Split it by team first (metric 5 shows why).
2. Turnover Rate: Overall, Voluntary and Involuntary
Turnover rate measures the share of employees who leave during a period, and splitting it into voluntary and involuntary exits shows whether people are choosing to go.
Average headcount in our example is (200 + 210) ÷ 2 = 205, so overall turnover is 20 ÷ 205 = 9.8%. Of that, 6.8% is voluntary and 2.9% involuntary. Keep your eye on the voluntary line, since that is the part people chose. When it rises, look at exits by manager and by tenure band before you start guessing at causes. Our employee turnover rate guide covers the full calculation.
3. Average Employee Tenure
Average employee tenure measures how long employees typically stay with the company.
Look at the mean and the median together. In our example a few long-timers drag the mean up to 4.2 years, while the median sits at 2.8, which is nearer to what a typical employee has lived. Then group people into bands: 0 to 1, 1 to 3, 3 to 5 and 5+ years. If exits bunch up in one band, you have found a moment worth studying, like the first anniversary.
Tenure itself lags, but milestones are something you can act on. Automating long service awards makes sure the 1-, 3- and 5-year marks get noticed instead of slipping by.
4. Regrettable Attrition Rate
Regrettable attrition rate measures the share of your headcount lost to voluntary exits of high performers or people in critical roles.
Say 5 of our 14 voluntary leavers were top performers or held critical roles. Regrettable attrition is then 5 ÷ 205 = 2.4%. Agree the classification rules up front, using performance reviews, role criticality and leadership input, so nobody decides after the fact who counts as regrettable. Some lists track this twice, as "regrettable attrition" and "talent turnover". They measure the same thing, so I have merged them. A healthy 90% retention rate can hide this one, because losing your best people costs more than losing an average person. For the wider picture, see our guide to attrition rate.
5. Retention Rate by Segment
Retention rate by segment measures retention separately for each manager, team, role or demographic group instead of for the company as a whole.
I learned this one the hard way. We once had an 88% retention rate overall, but one team was down at 60%. We would not have caught that without breaking the number down. In a healthy company the segments look broadly alike. When one sits well below the rest, I would check manager changes, workload and recognition before pay.
Survey sentiment split by team can show where a problem began, often months before the exits. That is what department-wise insights in Vantage Pulse are for.
6. New Hire Retention Rate
New hire retention rate measures the share of a hiring cohort that is still employed after a set period, usually 90 days or one year.
If 27 of our 30 new hires are still there at 90 days, the 90-day rate is 90%. It matters because early exits are a large share of the total: the Work Institute's 2025 Retention Report (2024 data) found that as much as 40% of overall turnover occurs within the first year of employment. A cluster of quick quits, meaning resignations inside three months, usually means the job people got is not the job they were sold. Check the job description against the real role first, then the first week, then the manager. Your offboarding process is a good place to capture why they left.
7. Cost of Turnover
Cost of turnover measures the total expense of losing and replacing an employee, including costs that never appear on a single invoice.
| Cost | What to count |
|---|---|
| Recruiting (direct) | Job ads, agency fees, recruiter time, interview hours |
| Onboarding and training (direct) | Equipment, trainer time, the ramp-up period before full output |
| Lost productivity (indirect) | The vacancy period and the new hire's learning curve |
| Team impact (indirect) | Extra workload on colleagues, knowledge that walks out, lower morale |
Rather than rely on one headline figure, calculate your own from the table, and use the Work Institute's 33% of base pay (2025 Retention Report) as a sanity check. The report calls this a conservative estimate and gives $16,500 or more as the cost of replacing someone who earns $50,000 a year. Your own figure may run higher, because indirect costs depend heavily on the role. See the true cost of attrition for a longer breakdown.
Leading Metrics: Who May Leave Next
Leading metrics move weeks or months before resignations do, which is why they are the ones worth reviewing monthly.
Intent to stay is a survey signal, not measured turnover. That is exactly what makes it a leading metric: you can see it while the person is still in the building.
What employees in high-recognition cultures report
Share of employees in high-recognition cultures giving a positive response.
Source: The Recognition Effect (Great Place To Work India and Vantage Circle, 2025).
These three figures are survey responses from high-recognition cultures. Intent to stay is a survey measure, not actual turnover. See the full Recognition Effect report for the full data cuts.
8. Employee Net Promoter Score (eNPS)
Employee Net Promoter Score (eNPS) measures how likely employees are to recommend your organization as a place to work.
In our example, 45% promoters and 15% detractors give an eNPS of +30. One labelling warning: eNPS is not an "employee satisfaction rate", because being satisfied and being willing to recommend are different things. It works best as a trend. Ask the same question every quarter and a drop in one team shows up before the resignations do.
Charu Purohit, an HR and rewards consultant, named retention rate, engagement score, eNPS and absenteeism as the core set she uses to judge whether a rewards program works, on our Vantage Influencers podcast. Her point was simple: you can only know something worked if you measure it from the right sources. For the detail, read our eNPS guide or run an eNPS survey.
9. Employee Engagement Score
Employee engagement score measures how involved, enthusiastic and committed employees are, usually from a short survey on a fixed scale.
Use a validated engagement survey and keep the questions stable, otherwise you cannot compare one quarter with the next. The direction and the gap between teams matter more than any single score. If a team slips two quarters running, a short follow-up survey will usually tell you why. Our guide to employee engagement metrics goes deeper on the survey side.
10. Recognition Coverage Rate
Recognition coverage rate measures the share of employees recognized at least once in a set window, usually the last 90 days.
In our example, 140 of 210 employees were recognized in the last 90 days, so coverage is 67%. Track it by manager, because an average hides the team where nobody has been thanked all quarter. I include this metric because, unlike resignations, you can move it directly.
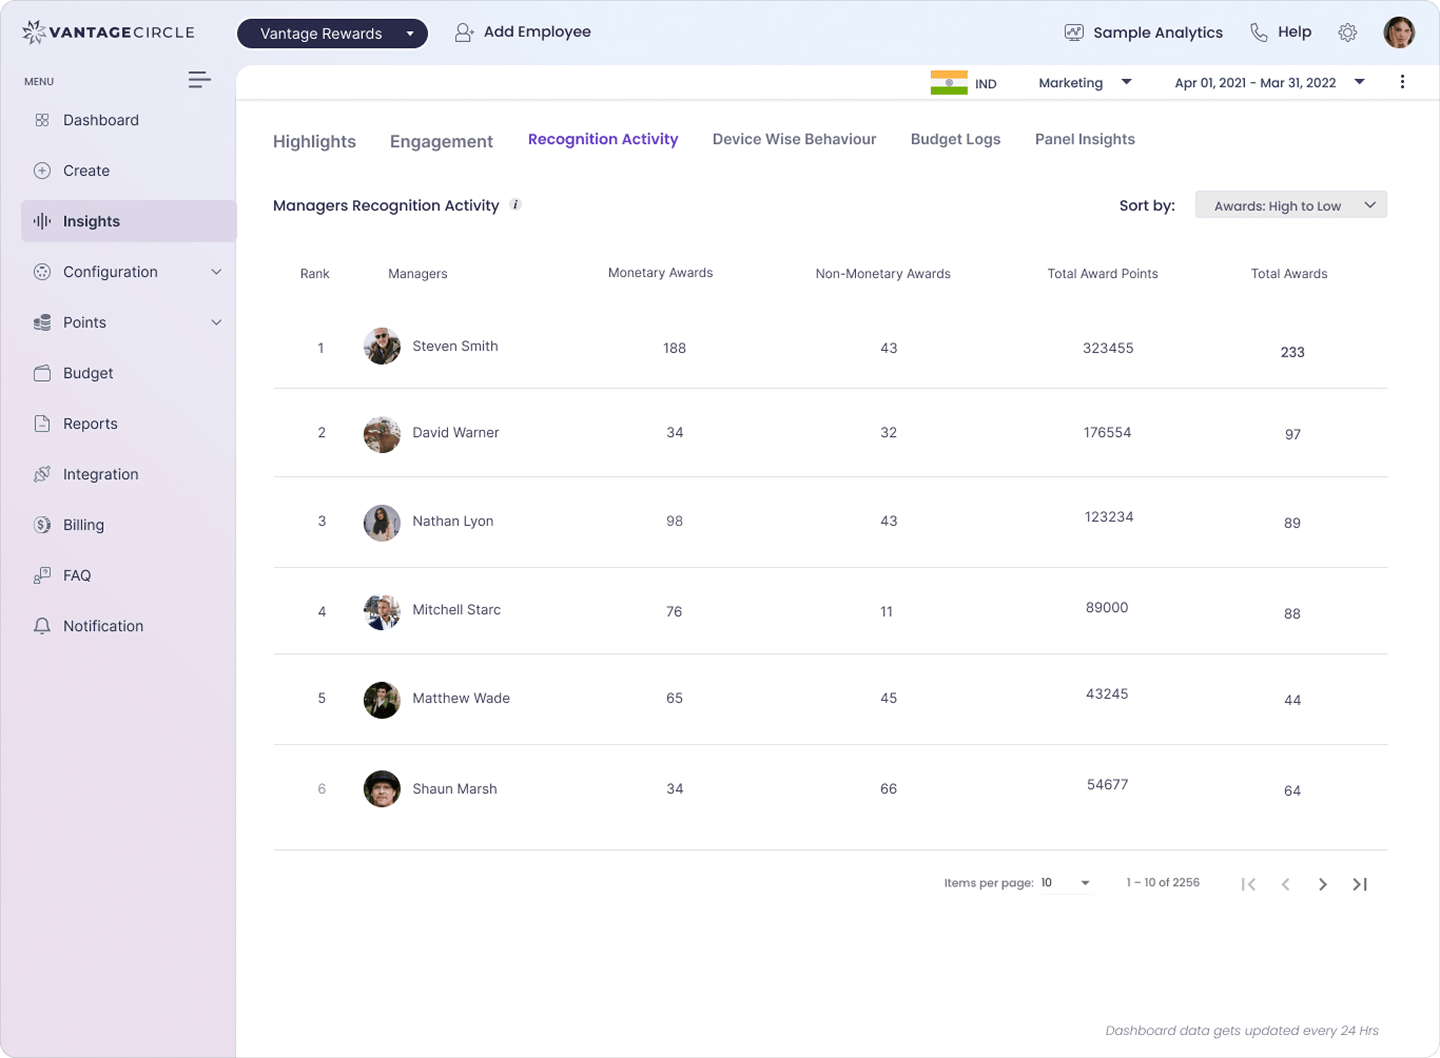
So recognition belongs on the scorecard as an input, not a nice-to-have. It only works if recognition is logged, though. A manager-level report in Vantage Recognition shows which teams have gone 90 days without anyone being recognized, and that is the gap to watch.
11. Absence Rate
Absence rate measures unplanned absenteeism over a given period.
In our example, 420 unplanned days missed across 210 people over a 63-day quarter gives 420 ÷ 13,230 = 3.2%. Watch the trend and the team split more than the absolute number. One team climbing steadily can point to burnout or disengagement well before its exits show up. Our guide to employee absenteeism covers causes and fixes.
12. Flight Risk Score
Flight risk score estimates how likely an employee or group is to leave, by combining several signals into one view.
A simple version scores each employee from 0 to 5 using five inputs: a low survey score, a rising absence trend, a high-risk tenure band, no recent recognition, and a recent drop in performance rating. Add them up and review everyone at 3 or above with their manager. You do not need a vendor model to start, and a simple score you understand beats a black box you do not.
Flight-risk models are only as good as their inputs. Anonymous pulse responses and sentiment trends capture what employees will not say to a manager, which is often what an exit interview finally reveals. You can collect anonymous feedback for that input, and use retention survey questions to get started.
Add a qualitative input too. Amber Vanderburg, founder of The Ninja Group, described on our podcast an international company whose people hold what is essentially a stay interview rather than an exit interview, asking what the company can do to help someone succeed. A stay interview tells you why people stay while you can still act on it. An exit interview tells you why they left once it is too late.
How to Analyze Retention Metrics So They Lead to Action

Segment first, trend second, benchmark third. One company-wide number hides the teams that are losing people.
At first, I thought just knowing our retention numbers was enough. But over time, I learned it is how you look at them that matters.
1. Look Beyond the Overall Number
Break retention down by team, role, department, manager and years of service, as metric 5 showed. A single company-wide figure would have told us we were fine.
2. Watch for Trends
A small drop might not seem like a big deal, but patterns matter. If new hires are leaving more often, it could point to onboarding or culture. I like to track quarterly retention and voluntary exits side by side to catch early warning signs.
3. Compare With Benchmarks
Benchmarks only help if the definition matches yours. Compare voluntary turnover with quits data for your industry, and read the benchmark section below for the sources and their limits.
4. Do Not Just Trust Averages
Any average can be skewed by a few extreme cases, so pair it with the median and a breakdown by band, as in metric 3.
5. Keep Your Data Clean
Messy data gives bad insights. Make sure exit dates and reasons are filled in, and that voluntary and involuntary exits are tagged the same way every time. One missing field can throw everything off.
Why Retention Is Hard to Move
Retention is a result, so tracking only the outcome tells you little about what to change.
It rarely moves when you push on it directly. It moves when the things upstream improve: how often people are recognized, how their managers behave, whether they feel heard. Those are your leading metrics.
So I would review leading metrics monthly and lagging ones quarterly. For what to do once a signal shows up, see our guide to employee retention strategies.
What Is a Good Employee Retention Rate? Benchmarks by Industry
There is no official standard for a good retention rate, and the right number depends on industry and role. Many teams use about 90% a year as a working target, but that is a convention, not a benchmark.
For an official benchmark, the US Bureau of Labor Statistics publishes quits rates by industry in its Job Openings and Labor Turnover Survey (JOLTS). Two cautions apply. JOLTS rates are monthly averages, so the table shows an approximate annual equivalent (monthly rate × 12) as well. And quits cover only voluntary resignations, so they will be lower than total turnover.
| Industry | Average monthly quits rate, 2025 | Approx. annual quits (monthly × 12) |
|---|---|---|
| Accommodation and food services | 4.2% | 50.4% |
| Retail trade | 2.6% | 31.2% |
| Professional and business services | 2.3% | 27.6% |
| Health care and social assistance | 2.0% | 24.0% |
| Financial activities | 1.4% | 16.8% |
| Manufacturing | 1.4% | 16.8% |
| Information | 1.3% | 15.6% |
| Government | 0.8% | 9.6% |
Source: US Bureau of Labor Statistics, JOLTS Table 22, annual average quits rates by industry, not seasonally adjusted, 2025. The all-private-sector average is 2.2% a month, or roughly 26% a year.
Here is how I would use it. If your voluntary turnover runs well above your industry's figure, dig in. If you sit below it, check the segment view before celebrating, because a low company-wide number can still hide a team that is losing people.
Role matters too. Junior and frontline roles usually turn over faster than senior ones, so compare like with like. Do not worry if entry-level roles run above the company average. Pay more attention to patterns and to regrettable attrition. For more numbers, see our employee retention statistics roundup.
Build Your Retention Scorecard
A retention scorecard puts 4 to 6 metrics on one page, each with an owner, a cadence and a trigger for action. The table below is a starting point. The triggers are examples, so set your own from your first two quarters of data.
| Metric | Type | Cadence | Owner | Action trigger (example) |
|---|---|---|---|---|
| Overall retention rate | Lagging | Quarterly | HR leader | Falls two quarters in a row |
| Voluntary turnover rate | Lagging | Quarterly | HR business partner | Above your industry's quits benchmark |
| Regrettable attrition rate | Lagging | Quarterly | HR leader and department head | Any exit of a critical-role holder triggers a review |
| New hire retention (90 days) | Lagging | Quarterly | Talent acquisition and onboarding | Two or more quick quits from one cohort |
| eNPS | Leading | Quarterly | HR leader | Team score drops by a set margin versus last quarter |
| Engagement score | Leading | Quarterly | HR business partner | Team score falls two quarters in a row |
| Recognition coverage rate | Leading | Monthly | People managers | Any team with no one recognized in 90 days |
| Absence rate | Leading | Monthly | People managers | Steady climb in one team over three months |
A scorecard works when leading and lagging metrics sit side by side. Seeing recognition activity and engagement trends next to quarterly retention is what makes the cause-and-effect conversation possible.
Conclusion
Metrics are helpful, but they are not the solution. They tell you something is off, but not always why, and not how to fix it.
I used to obsess over dashboards and percentages. Over time I learned that retention does not start with a spreadsheet. It starts with how people feel at work. Are they supported? Do they feel like they are? Can they grow here?
Engagement is a good place to look. In the 11th edition of Gallup's Q12 meta-analysis (2024), which covers 347 organizations, business units in the top quartile for engagement had a median 21% lower turnover than bottom-quartile units in high-turnover organizations, and 51% lower in low-turnover organizations. Gallup defines high-turnover organizations as those with more than 40% annualized turnover.
So use the metrics. But more importantly, listen to your people, build trust, and create an environment where no one feels rushed to leave.
There is an old saying in HR that people leave managers, not companies. It is a rule of thumb rather than a measured law, but it is worth keeping in mind when one team's numbers look different from the rest. Behind every metric is a person, and how we lead and support them makes the difference.
Frequently Asked Questions
How do I calculate employee retention rate?
Take the people you started the period with, count how many are still employed at the end, divide by the starting number and multiply by 100. Anyone hired in between stays out of the count. Start with 200, finish with 180 of those same people, and you get (180 ÷ 200) × 100 = 90%.
Is 20% attrition good?
It depends on your industry and, more importantly, on who is leaving. For comparison, the US private sector averaged about 26% a year in voluntary quits in 2025 (BLS JOLTS, monthly rate × 12), while sectors like finance and government ran lower. If most of that 20% is high performers, it is worse than the number suggests.
Is 90% employee retention good?
Often, yes, but no official standard sets it. Many teams use about 90% a year as a working target. Check it by team and by industry, because a good company-wide number can hide a weak segment.
What are the 5 C's of employee retention?
There is no single standard version. One common set is compensation, culture, career growth, connection and communication. You can map each to a metric: compensation to voluntary turnover, culture to eNPS, career growth to tenure bands, connection to engagement score, and communication to survey response rates.
What are the four pillars of employee retention?
There is no single standard here either. One common framing is fair pay and benefits, a supportive work environment, growth opportunities, and recognition. In practice, each pillar needs at least one leading metric so you can see it weaken before people leave.
What are the top 5 employee retention strategies?
The strategies that come up most often are fair pay, career development, strong managers, regular recognition and flexible work. For a full breakdown with examples, read our guide to employee retention strategies.

Lupamudra is a content marketing specialist at Vantage Circle, where she has written 50+ articles on employee recognition, rewards, and workplace culture, alongside employee engagement, diversity and inclusion, and HR compliance topics, including how India's tax rules apply to recognition and rewards programs.
Connect with Lupamudra on LinkedIn.