Employee Retention Report Template
Free employee retention report template (Excel) with retention rate, turnover rate, and cohort formulas built in. Track workforce stability month-over-month.
What Is an Employee Retention Report Template?
An employee retention report template is a pre-built Excel framework that HR teams use to track who stays, who leaves, and why — across departments, tenure groups, and reporting periods. It standardizes how retention rate, turnover rate, and cohort attrition are calculated so leadership reads the same numbers every month.
Voluntary turnover costs U.S. employers an estimated $1 trillion every year, according to Gallup. Replacing a single employee can cost between one-half and two times their annual salary — research from Gallup and SHRM consistently places the figure in that range. A standardized retention report makes that cost visible before the next quarter's hiring plan is signed off.
This template includes the four formulas most HR teams need (retention rate, total turnover, voluntary vs. involuntary split, and cohort retention), a department-level attrition view, and a tenure distribution chart. Pair it with structured recognition workflows from the Recognition Templates hub — recognition-rich workplaces report up to 31% lower voluntary turnover (Bersin / Deloitte).
How to Use This Employee Retention Report Template?
A four-step process to build a defensible retention report from raw HRIS data.
Step 1
Step 1: Define the Reporting Period
Lock the start and end dates before you pull any data. Mixing employees from a 12-month period with leavers from a 9-month period is the most common reason retention reports get challenged in board reviews.
Most HR teams run a monthly retention pulse, a quarterly trend report for executives, and an annual workforce report aligned to fiscal year close. Year-over-year comparisons require identical period boundaries on both sides.
Step 2
Step 2: Gather Workforce Data
Pull headcount at the start of the period, new hires during the period, voluntary exits, involuntary exits, and average tenure from your HRIS — Workday, BambooHR, ADP, SAP SuccessFactors, or equivalent. Tag each exit with department, role level, and tenure bucket.
Reconcile two systems before reporting: payroll and HRIS counts often disagree by 1–3% because of contractor reclassifications and mid-period role changes. Document the source of truth in the report footer.
Step 3
Step 3: Calculate Retention Metrics
Apply the four core formulas: retention rate, total turnover rate, voluntary turnover rate, and cohort retention. The template's pre-built cells reference the data tab, so refreshed inputs propagate to the dashboard automatically.
Always report voluntary and involuntary turnover separately. A 14% combined turnover rate can hide a 12% voluntary attrition crisis or a 12% layoff round — the strategic implications are opposite.
Step 4
Step 4: Analyze Trends and Recommend Action
Layer department, tenure, and manager dimensions on top of the headline number. Most attrition concentrates in two to three predictable pockets: 0–12 month tenure (onboarding mismatch), specific managers (the manager-effect), and roles where market pay has shifted.
Close the report with two or three recommended interventions tied to specific findings — for example, a stay interview program for the highest-attrition tenure cohort, or a recognition cadence change in the team driving the spike. Reports without recommendations rarely move budget.
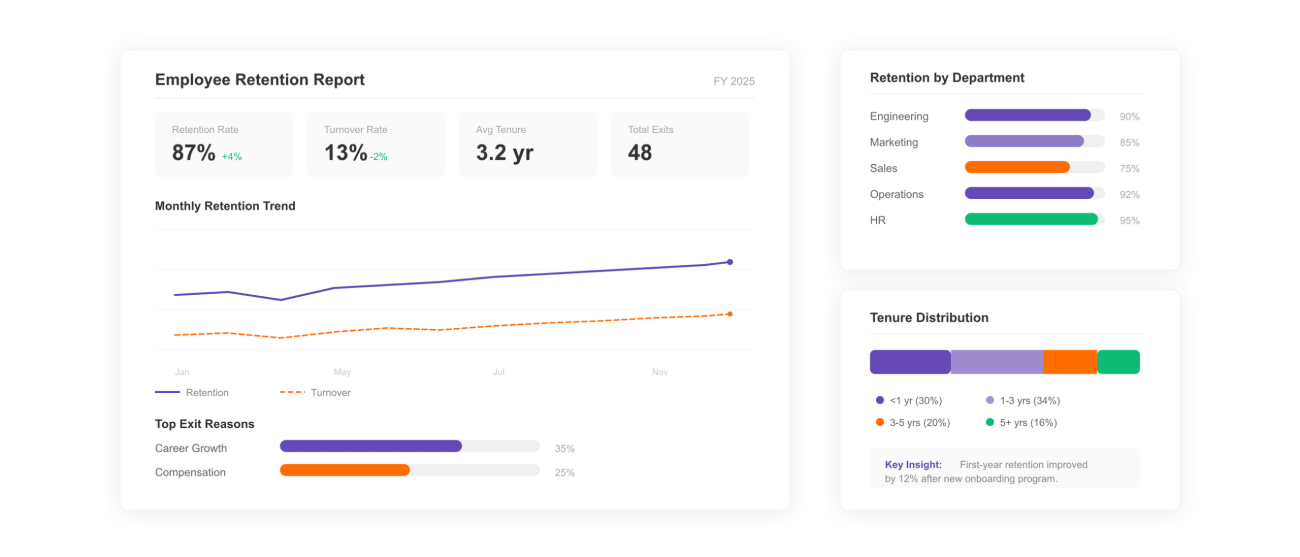
The 4 Retention Formulas Built Into This Template
Every HR retention report rests on the same four formulas. The template ships with these in pre-built Excel cells; the definitions below let you verify the math before publishing.
1. Employee Retention Rate
Retention Rate (%) = (Employees Retained Through Period ÷ Headcount at Start of Period) × 100
"Retained" excludes new hires during the period. Use the same starting cohort each time for valid month-over-month comparison. SHRM's 2024 benchmark for healthy annual retention sits at 84–90% across industries.
2. Total Turnover Rate
Turnover Rate (%) = (Total Separations During Period ÷ Average Headcount) × 100
Average headcount = (start headcount + end headcount) ÷ 2. The U.S. Bureau of Labor Statistics reports an average annual turnover rate of about 47% across all sectors; knowledge-work industries average 13–17%.
3. Voluntary Turnover Rate
Voluntary Turnover (%) = (Voluntary Resignations ÷ Average Headcount) × 100
The signal that matters most for engagement and recognition strategy. SHRM places healthy voluntary turnover at 10% or below for most industries; anything above 15% generally indicates an engagement, manager, or compensation issue.
4. Cohort Retention (90-Day, 1-Year)
Cohort Retention (%) = (Cohort Members Still Employed at Day N ÷ Original Cohort Size) × 100
90-day cohort retention exposes onboarding effectiveness; 12-month retention exposes manager and engagement quality. Best-in-class organizations hold 95%+ at 90 days and 88%+ at 12 months.
Retention Benchmarks: What Does Healthy Look Like?
Headline numbers without context produce alarmist or complacent reports. Use these published benchmarks alongside the template's calculations to frame each finding.
| Metric | Healthy Range | Source |
|---|---|---|
| Annual employee retention rate | 84–90% | SHRM 2024 Talent Benchmarks |
| Voluntary turnover (knowledge industries) | 8–13% | U.S. BLS, JOLTS series |
| 90-day new-hire retention | 90–96% | SHRM Onboarding Research |
| 12-month retention (technology sector) | 85–88% | LinkedIn Workforce Report 2024 |
| Voluntary turnover with strong recognition culture | ~31% lower than peers | Bersin / Deloitte |
Use these as orientation, not targets. Industry, geography, and company stage all shift the healthy band. The right comparison for your numbers is your own trailing 12 months alongside your industry peer set.
What Makes an Effective Employee Retention Report?
A retention report earns budget when it pairs reliable data with clear action. The five characteristics below distinguish a useful report from one leadership ignores.
1. Reproducible methodology
Same formulas, same source systems, same period boundaries every cycle. A report whose definitions move quarter to quarter loses credibility the moment the trend line is challenged.
2. Voluntary and involuntary separated
Aggregating these masks the signal HR leaders are paid to find. Layoff turnover and resignation turnover require entirely different responses, and reporting them as one number lets root causes hide in plain sight.
3. Segmented by department, tenure, and manager
Headline retention rates rarely move attention. Department-level attrition and manager-cohort retention are the cuts that surface the real work to do — and the people accountable for it.
4. Benchmarked against industry data
Cite SHRM, BLS, or LinkedIn workforce data for your sector alongside internal numbers. A 12% voluntary turnover rate sounds different next to a tech-sector benchmark of 13–17% than next to a manufacturing benchmark of 4%.
5. Closes with named interventions
Two to three specific actions, each tied to a finding. "Launch stay interviews in Customer Success" is actionable; "Improve culture" is not. The report's job is to make the next decision easier.
6. Easy to refresh
Replacing the data tab should regenerate the entire dashboard. The Excel template uses formula-linked cells so monthly refresh takes minutes, not hours, and so the same file produces consistent reports across the year.
Explore Employee Recognition & Engagement Templates
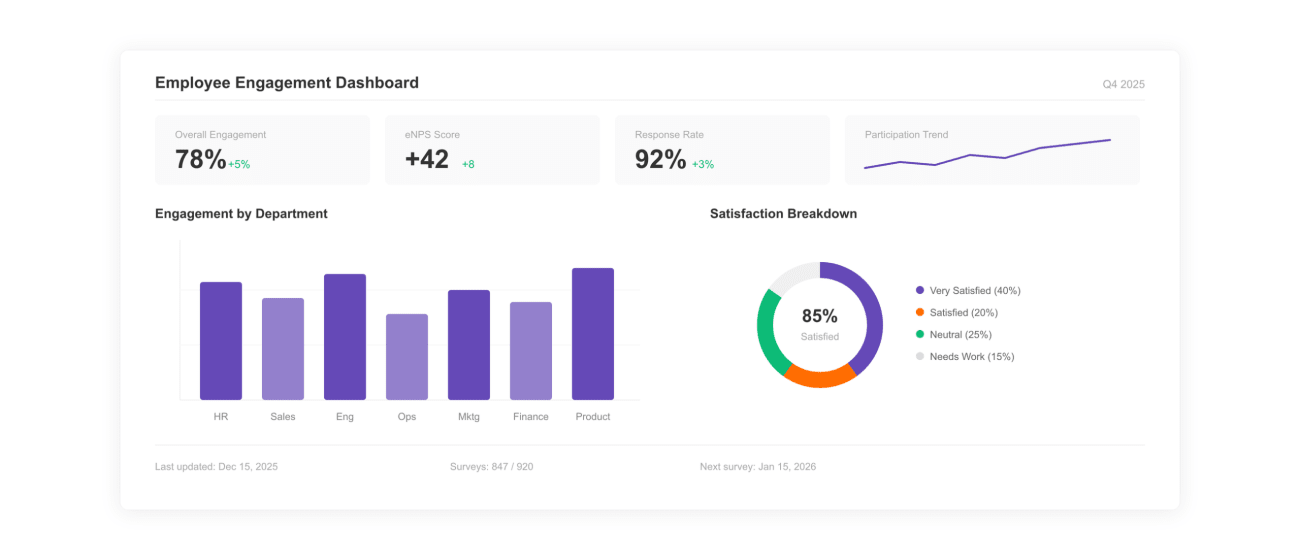
Employee Engagement Dashboard Template
Track engagement scores, eNPS, and participation alongside retention metrics.
View Template ›
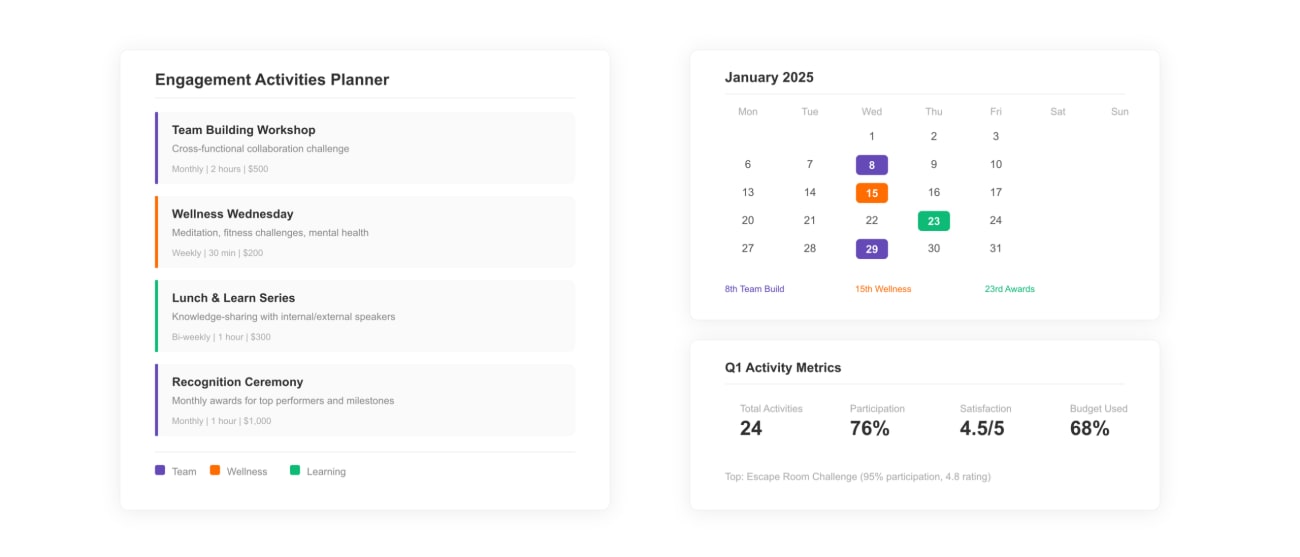
Employee Engagement Activities Template
Plan engagement programs that close the retention risk pockets your report surfaces.
View Template ›
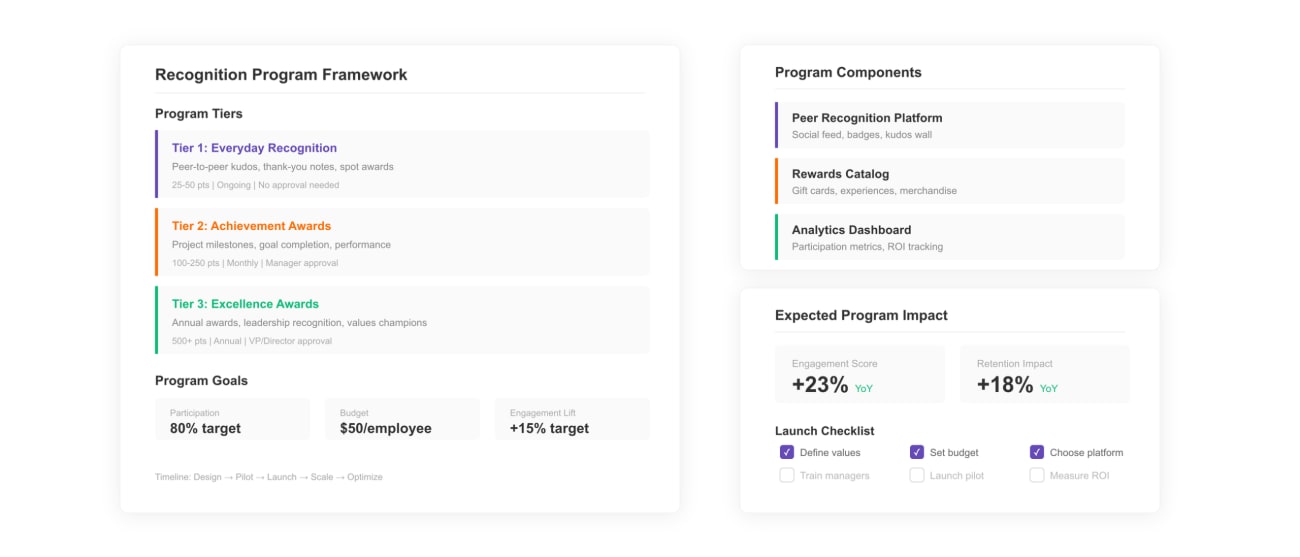
Employee Recognition Program Template
Build the structured recognition cadence linked to lower voluntary turnover.
View Template ›
Frequently Asked Questions
Want to See How Vantage Circle Powers Recognition?
Explore the Platform